
Thursday, July 28, 2016
Tuesday, July 26, 2016
The Willie Davis Method and OPS+ Park Factors
This post is going to lay out the math necessary to apply the so-called "Willie Davis method" of Bill James to his Runs Created and to Base Runs. The last three posts have explained how you can use it with Linear Weights. This is offered in the interest of comprehensiveness, should you decide that you’d like to fiddle with this stuff yourself.
The Willie Davis method as explained by Bill James is based on the most basic RC formula, (H + W)*TB/(AB + W). You could use one of the technical RC versions too, of course, but then you would introduce the problem of what to do with all of the ancillary categories that are included in those versions. A minor modification that would help matters is to give a weight to walks in the B factor (which is simply TB in the basic version), but James has never done that as it would complicate the basic version and mess up all of the neat little RC properties like OBA*SLG*AB = runs.
While I tried to emphasize that I wouldn’t take any of the results from the linear weight translations too seriously, the output of the Willie Davis method is actually used by Sean Forman to calculate OPS+ at baseball-reference.com. So while James used it in the vein that I advocate, Forman uses it to park-adjust the most-looked at total offensive statistic at his site. For this reason, I’ll compare park-adjusted OPS+ figured by his method to what I would do later in the post.
To apply the Willie Davis method to RC, first define a = 1 + W/H, b = TB/H, and outs as AB-H. You also need to calculate New RC, which I will abbreviate as N. That is just regular RC times the adjustment factor you are using (in a park case, if the PF is 1.05 then N is RC*1.05). Then this relationship holds:
N = (a*H)*(b*H)/(a*H + Outs)
This can be manipulated into a quadratic equation:
abH^2 - NaH - N*Outs = 0
And then we can use the quadratic equation to solve for H, which we’ll call H’:
H' = (Na + sqrt((Na)^2 + 4ab(N*Outs)))/(2ab)
The adjustment factor for all of the basic components (S, D, T, HR, W with outs staying fixed) is simply H'/H. So we multiply the positive events by H'/H and the result is a translated batting line.
Since we have applied this type of approach to RC and LW, we might as well do it for Base Runs as well. Allow me to start with this particular BsR equation, published some time ago by David Smyth:
A = S + D + T + W
B = .78S + 2.34D + 3.9T + 2.34HR + .039W
C = AB - H = outs
D = HR
BsR is of course A*B/(B + C) + D, and New BsR (N) is BsR*adjustment factor. To write everything in terms of singles, let’s define a, b, and c (of course, I didn’t realize until after I wrote this that a, b, and c are terrible abbreviations in this case, but I already had them in my spreadsheet and it would have been a real pain to change everything):
a = (S + D + T + W)/S
b = (.78S + 2.34D + 3.9T + 2.34HR + .039W)/S
c = HR/S
Then we need to solve for S' (the new number of singles) in this equation:
aS'*bS'/(bS' + Outs) + cS' = N
This results in a quadratic equation just as the RC approach does, and it can be solved:
S' = (Nb - cOuts + sqrt((cOuts - Nb)^2 + 4(NOuts)(ab + bc)))/(2*(ab + bc))
S'/S is then the multiplier for all of the positive events.
So we have three different approaches based on three different run estimators to accomplish the same task. Which one should be used? Unfortunately, there’s no good empirical way to test these approaches; the entire point of having them is to make estimates of equivalent value under different conditions…i.e. conditions that did not occur in reality.
However, I think it should be self-evident that the quality of the model from which the estimate is derived says a lot about its value. I don’t need to beat that horse again, but it is well-known that Basic RC is not a very good estimator when applied to individuals, which is exactly what we are doing here.
It would also follow that the Linear Weights-based approach should be marginally better than the Base Runs-based approach since BsR should not be applied directly to individuals. Since BsR is better constructed than RC, though, the discrepancies shouldn’t be as bothersome.
I am going to use the three approaches to derive park-adjusted BA, OBA, and SLG for the 1995 Rockies. In all of the calculations, I am using a 1.23 park factor for Coors Field. The unshaded columns are the players’ raw, unadjusted numbers; the pink columns are adjusted by the RC approach, orange by the ERP approach, and yellow by the BsR approach:
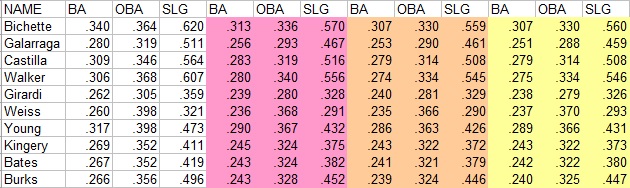
From eyeballing the numbers, I’d say that there is a strong degree of agreement between the ERP and BsR estimates, with the RC estimates as the outliers. As mentioned above, this is along the lines of what I would have expected to see, as both ERP and BsR are better models of the run scoring process than RC. That the ERP and BsR results are close should not come as a surprise, as both estimators give similar weight to each event.
Using RC results in a less severe park adjustment for most players. Why is this? My guess is that it is because RC, with it’s well-known flaw of overvaluing high-end performance, naturally needs to draw down the player’s OBA and SLG less then ERP or BsR to still maintain a high performance. In other words, RC overestimates Larry Walker’s run contribution to begin with, and since the problem only gets worse as OBA and SLG increase, it doesn’t take that that big of a change in OBA or SLG to reduce run value by X%.
As I mentioned earlier, I think it is worth looking at the Willie Davis method closely since some sources (particularly Baseball-Reference) use it for serious things like park-adjusting OPS+. This is in contrast to the position of its creator, Bill James, who presented it more as a toy that yields a rough estimate of what an equal value performance would look like in a different environment.
So, here are the OPS+ figures for the 1995 Rockies figured seven different ways. Let me note off the bat that I am using OBA = (H + W)/(AB + W); for this reason and the fact that I am using my own Coors PF, we should not anticipate exact agreement between these OPS+ results and the ones on Baseball-Reference. The league OBA in the 1995 NL was .328, and SLG was .408, so the basic formula for OPS+ is:
OPS+ = 100*(OBA/.328 + SLG/.408 - 1)
The first column of the table, "unadj" uses the player’s raw stats with no park adjustment. The second column, "trad", reflects the traditional method of figuring OPS+ used by Pete Palmer in The Hidden Game of Baseball, Total Baseball, and the ESPN Baseball Encyclopedia: simply divide OPS+ by the runs park factor (1.23) in this case.
The third column, "sqrt", adjusts OBA and SLG separately by dividing each by the square root of park factor, and uses these adjusted figures in the OPS+ formula above (*). The fourth column, "reg", uses the runs factor to estimate an OPS+ park factor based on a regression equation that relates OPS+ to adjusted runs/out (this is covered in the digression as well).
Finally there are three shaded columns, which use the translated OBA and SLG results from RC, ERP, and BsR respectively as the inputs into the OPS+ equations:

What can we see from this? The traditional approach is more severe than any of the Willie Davis approaches, while the square root approach is a pretty good match for the Willie Davis approaches. Thus, I suggest that the best combination of ease and accuracy in calculating OPS+ is to divide OBA and SLG by the square root of park factor, then plug the adjusted OBA and SLG into the OPS+ equation.
Of course, I should point out that 1995 Coors Field and its 1.23 park factor is one of the most extreme cases in the history of the game. For run of the mill environments, we should expect to see little difference regardless of how the park adjustments are applied, and so I am NOT saying that you should disregard the OPS+ figures on Baseball-Reference (although I do wish that OPS+ would be pushed aside in favor of better comprehensive rate stats). On the other hand, though, I see no reason to use a complicated park adjustment method like the Wille Davis approach when there are much easier approaches which we have some reason to believe better reflect true value.
(*) I shunted some topics down here into a digression because it covers a lot of ground that I’ve covered before and is even drier than what is above. And a lot of sabermetricians are sick and tired of talking about OPS, and I don’t blame them, so just skip this part if you don’t want to rehash it.
As I’ve explained before, OPS+ can be thought of as a quick approximation of runs/out. Some novice sabermetricians are surprised when they discover that OPS+ is adjusted OBA plus adjusted SLG minus one rather than OPS divided by league OPS. And it’s true that the name OPS+ can be misleading, but it is also true that it is a much better metric. One reason is that OPS/LgOPS does not have a 1:1 relationship with runs/out; it has a 2:1 relationship. If a team is 5% above the league average in OPS, your best guess is that they will score 10% more runs. So the OPS/LgOPS ratio has no inherent meaning; to convert it to an estimated unit, you would have to multiply by two and subtract one.
The other reason why OPS+ is superior is that it gives a higher weight to OBA. It doesn’t go far enough--the OBA weight should be something like 1.7 (assuming SLG is weighted at 1), while OPS+ only brings it up to around 1.2--insufficient, but still better than nothing.
Anyway, if you run a regression to estimate adjusted runs/out from OPS+, you find that it’s pretty close to a 1:1 relationship, particularly if you include HB in your OBA. I haven’t though, and so the relationship is something like 1.06(OPS+) - .06 = adjusted runs/out (again, it should be very close to 1:1 if you calculate OPS+ like a non-lazy person). The "reg" park adjustment, then, is to substitute the park factor for adjusted runs/out and solve for OPS+, giving an OPS+ park factor:
OPS+ park factor = (runs park factor + .06)/1.06
The slope of the line relating OPS+ to runs/out is not particularly steep, and so this is an almost negligible adjustment--for Coors Field and its 1.23 run park factor, we get a 1.217 OPS+ park factor.
Now a word about the traditional runs factor v. the individual square root adjustments. Since OPS+ is being used as a stand-in for run creation relative to the league average, I would assume that the goal in choosing a park adjustment approach is to provide the best match between adjusted OPS+ and adjusted runs/out. It turns out that if you figure relative ERP/Out for the ’95 Rockies players, the results are fairly consistent with the ERP/BsR translated OPS+. Thus, I am going to assume that those are the “best” adjusted OPS+ results, and that any simple park adjustment approach should hope to approximate them.
As a consequence, the square root adjustments to OBA and SLG look the best. Why is this? I’m not exactly sure; one might think that since OPS+ is a stand-in for relative runs/out, we should expect that the best adjustment approach once we already have unadjusted OPS+ is to divide by park factor. Yet we can get better results by adjusting each component individually by the square root of PF. OPS+ is far from a perfect approximation of relative runs/out, though, so it may not be that surprising that applying OPS+ logic to park factors is not quite optimal either.
Interestingly, the justification for the square root adjustment can be seen by looking at Runs Created in its OBA*SLG form. While OBA*SLG gives you an estimate of runs/at bat, not runs/out, it is of course related. If you take OBA/sqrt(PF)*SLG/sqrt(PF) you get OBA*SLG/(sqrt(PF)*sqrt(PF)) = OBA*SLG/PF
It is quite possible that there is a different power you could raise PF to that would provide a better match for our ERP-based OPS+ estimates, but getting any more in-depth would defeat the purpose of having a crude tool. In fact, I think that adjusting OPS+ by the Willie Davis method goes too far as well. Regardless, I would be remiss if I didn’t again emphasize that the 1995 Rockies are an extreme case, and so while the differences between the approaches may appear to be significant, they really aren’t 99% of the time.
Monday, July 11, 2016
The Good News Is...
The good news is that OSU baseball had its most successful season under coach Greg Beals. The Buckeyes qualified for the NCAA Tournament and won a Big Ten title of any kind (tournament or regular season) for the first time since 2009 and won the Big Ten Tournament for the first time since 2007. Six Buckeyes were drafted, the most since 1998.
That’s the good news, and it is legitimately good news. The bad news is they finished third in their NCAA regional, knocked out by an in-state foe with no particular history of being a quality baseball program (Wright State); the six drafted players are part of a mass exodus of talent that will leave the 2017 team with little returning production; and the relative success of the season should solidify Beals’ position.
I am not the type of fan that roots for my team to lose because I think that they would be better off if the coach was fired, or other similar reasoning (given the perverse incentives created by pro sports drafts, it may some times be in the team’s best interest to lose, but that never applies to college sports). So the last bit of bad news is worth it given a new trophy for the case. Nevertheless, it remains a cost associated with the season.
At first, it did not appear as if this would be the best season of Beals’ tenure. While OSU embarked on Big Ten play with a 12-6-1 record, it was not particularly impressive given the quality of competition. OSU took two out of three at home from Northwestern in the first Big Ten series, needing a come-from-behind walkoff homer to pull the series out on Sunday (Northwestern would finish twelfth in the Big Ten at 7-17). The Bucks were then swept at Maryland, won a home series against Rutgers and lost a series at Illinois to sit at 5-7 halfway through the Big Ten schedule.
Both road series featured memorable losses. In the second game against Maryland, John Havird took a no-hitter into the ninth, but was pulled with a 1-0 leading and 98 pitches after plunking the leadoff hitter. Maryland pushed across the run without the benefit of a hit, giving OSU a combined nine no-hit innings, but two hits lead to a Terrapin run in the tenth and a 2-1 loss. The opener against Illinois wound up as a 1-0 loss in fifteen innings on a wild pitch, in a game in which Illini starter (and future Baltimore first rounder) Cody Sedlock was allowed to make 132 pitches in 10 2/3 innings (one of Beals’ redeeming qualities as a coach is that he rarely pushes the envelope with his pitchers--Tanner Tully was done after 9 and 106 pitches).
The Buckeyes opened the second half with a sweep of hapless (2-22) Purdue, then won a home series from Iowa and swept Michigan at home to get to 13-8, technically still alive in the conference race heading into the finale at Minnesota (first place at 15-5). The Buckeyes won two out of three, finishing 1.5 games behind the Gophers and 1 behind Nebraska, tied for third with Indiana. At this point it could be noted that OSU had a favorable Big Ten schedule; only three of the thirteen teams finished under .500 in conference play, and OSU played all of them (Purdue, Northwestern, Rutgers), while not playing Nebraska or Indiana.
The Buckeyes opened the tournament with a win over Michigan, but melted down in the ninth inning against Iowa by coughing up a 4-0 lead before losing in ten. Their next contest with Michigan was delayed by weather, forcing the Buckeyes to beat both Michigan and Michigan State on Saturday to stay alive. On Sunday morning, the Buckeyes beat MSU again to claw back through the loser’s bracket, into the winner-take-all final against Iowa that afternoon. The Bucks led 7-4 going into the eighth, but Iowa scored three to tie it. This time, OSU would answer with a run in the ninth and hold on for an 8-7 win to cap a remarkable two days of baseball with a long overdue championship.
OSU was made a #2 seed of the NCAA Tournament, but was deemed one of the weaker #2s and placed in a bracket with #2 national seed Louisville, #3 seed Wright State, and #4 seed Western Michigan. In a recurring tournament theme of losing leads, the Buckeyes opened up 5-0 on the Raiders through three before allowing two in the fourth and four in the fifth. WSU’s 6-5 lead held until the Buckeyes rallied for two in the ninth and a 7-6 win. Alas, Louisville’s offense proved too potent, burying the Bucks 15-3, and WSU extracted revenge with a 7-3 win that ended OSU’s season at 44-20-1.
OSU lead the Big Ten (all games) in W% at .688, was a close third in EW% at .676 (Minnesota led with .685), and was second in PW% (.679 to Minnesota’s .728). OSU had a balanced team, finishing third with 5.83 R/G and fourth with 3.98 RA/G (although it should be noted that Bill Davis Stadium appears to be a solid pitcher’s park). OSU was not a strong fielding team, with a .951 mFA compared to a conference average of .946, and more importantly a below-average DER (.675 to .681 average).
OSU’s offense was power-driven, leading the conference with 57 homers and a .151 ISO and a slightly above-average .348 OBA. Beals rode junior catcher Jalen Washington hard; Washington appeared in 63 of 65 games and created 4.3 RG. Junior Jacob Bosiokovic bounced back from injuries as the primary first baseman, creating 5.9 RG on the strength of power (11 homers, .213 ISO) rather than on base skills (.335 OBA). He was drafted by Colorado in the 19th round. Troy Kuhn settled back in at second base, but had his worst offensive season of three as a starter as a senior (just 4.3 RG). L Grant Davis struggled mightily at the plate (.194/.257/.256 in 151 PA), requiring OSU to sacrifice defense for offense at the keystone.
Nick Sergakis was third on OSU with 13 homers and was second on the team with 8.8 RG and +26 RAA with a .332/.420/.542 line, enough to be a 23rd selection by the Mets (Sergakis played three years at OSU after transferring from this year’s national champions, Coastal Carolina). Shortstop Craig Nennig, who Beals’ refusal to pinch-hit for was a running frustration of mine, made that less of an issue by turning in the best offensive season of his career, although .256/.313/.366 on the strength of five longballs hardly erased any concerns about production.
The outfield was led by junior Ronnie Dawson, who while productive in his first two years really played up to his potential with a team-high 13 homer, 9.3 RG, +32 RAA, .331/.415/.611 season that netted him several All-America honors and a second-round selection by Houston. Classmate Troy Montgomery had a fine season in center, hitting .297/.420/.466 for 7.7 RG and +20 RAA and was drafted in the 8th round by the Angels. Right field was filled by a combination of Bosiokovic and sophomore Tre’ Gantt, who couldn’t match the production from his freshman season (.255/.311/.314 for 3.6 RG in 158 PA).
Freshman Brady Cherry started the year on fire at DH with five homers, but settled into a .218/.307/.411 performance over 143. Senior Ryan Leffel (.205/.283/.301 in 96 PA) took some of his playing time as the year went on. Zach Ratcliff hit better than them early (.268/.362/.341 in 52 PA), but an injury ultimately resulted in a medical redshirt.
The pitching staff was anchored by junior Tanner Tully, who continued to be the perfect image of a finesse lefty with a 3.18 RA, 3.31 eRA, 1.9 W/9, 6.5 K/9, +19 RAA over 108 innings season. Tully was picked by Cleveland in the 26th round. Senior John Havird made it two lefties at the top of the rotation, pitching solidly (4.50 RA and +2 RAA, but 3.91 eRA and 5.8 K/1.5 W in 94 innings). Sophomore Adam Niemeyer was the #3, with similar results to Havird (4.56 RA for +1 RAA, 4.37 eRA, 8.9 K/1.5 W in 71 innings). As you can see, the strength of OSU’s starters was avoiding free passes. Freshman Ryan Feltner was the most frequent mid-week starter (11 starts out of 20 appearances) and wasn’t bad for a freshman (4.72 RA for 0 RAA, 5.67 eRA, 8.0 K/3.9 W in 69 innings). Senior transfer lefty Dalton Mosbarger got a few mid-week, limited inning starts (5 of 13 appearances) and was effective (3.31 RA for +5 RAA, 4.11 eRA, 8.3 K/4.1 W in 33 innings, in addition to his 35 PA as a reserve outfielder). Sophomore transfer Austin Woody rounded out the starters (3 of 19 appearances, 6.92 RA for -10 RAA, 7.75 eRA, 6.7 K/4.2 W in 39 innings).
OSU’s bullpen was terrific, with four key relievers chipping in. Sophomore Yianni Pavlopoulos was closer out of the gate despite just nine career innings and a medical redshirt in 2015, and recorded 14 saves and solid performance numbers (3.03 RA, 3.72 eRA, 10.3 K/3.3 W in 30 innings). Sidearm sophomore Seth Kinker was the workhorse, making 38 appearances and pitching great (1.98 RA for +17 RAA, 3.27 eRA, 7.4 K/1.6 W over 55 innings). Senior Michael Horejsei’s LOOGY role expanded a little, but not too extensively, working 31 innings in 34 appearances with a 3.19 RA, and excellent 1.93 eRA and 11.3 K/2.6 W). His selection in the 21st round by the White Sox as a situational reliever capped a remarkable career arc for a pitcher who began his college career at a regional campus (OSU-Mansfield) and had just 26 career innings entering 2016. Finally, sophomore Kyle Michalik chipped in +9 RA with a 2.25 RA, 2.29 eRA, 5.1 K/1.4 W performance over 32 innings, but was definitely fourth on Beals’ bullpen pecking order. Other pitchers who saw action include junior Joe Stoll and freshman Conor Curlis, who will presumably compete for the LOOGY role next year.
While 2016 was a measured success, the outlook for 2017 is murkier. OSU had a total of 84 offensive RAA contributed by individuals--83 of those contributed by non-returning players (1B Bosikovic, 3B Sergakis, LF Dawson, CF Montgomery). Additionally, OSU must replace Kuhn at second, Nennig at short (who was a very good fielder, at least to this observer’s eyes), and Leffel at utility/DH. It will essentially be a new offense and it will lack any proven plus performers. The rotation will lose two of its top three, but profiles as a more likely strength with Niemeyer and Feltner as two obvious members. To the extent that college bullpens can be predicted, OSU is well-positioned for 2017.
However, my concerns regarding player development were only slightly allayed, and Beals’ tactics may have been toned down a little bit (even he could see that he had power and should probably give away fewer outs on the bases), but one season does not a program make. It’s a positive step, at least, which is more than can be said for most of the previous seasons of Beals’ tenure. And that’s the good news.
Thursday, July 07, 2016
Great Moments in Yahoo! Box Scores

Mike Trout, the center field player, made a point in the match by "stealing" 4th base.
Subscribe to:
Posts (Atom)