Of all the annual repeat posts I write, this is the one which most interests me--I have always been fascinated by patterns of offensive production by fielding position, particularly trends over baseball history and cases in which teams have unusual distributions of offense by position. I also contend that offensive positional adjustments, when carefully crafted and appropriately applied, remain a viable and somewhat more objective competitor to the defensive positional adjustments often in use, although this post does not really address those broad philosophical questions.
The first obvious thing to look at is the positional totals for 2015, with the data coming from Baseball-Reference.com. "MLB” is the overall total for MLB, which is not the same as the sum of all the positions here, as pinch-hitters and runners are not included in those. “POS” is the MLB totals minus the pitcher totals, yielding the composite performance by non-pitchers. “PADJ” is the position adjustment, which is the position RG divided by the overall major league average (this is a departure from past posts; I’ll discuss this a little at the end). “LPADJ” is the long-term positional adjustment that I use, based on 2002-2011 data. The rows “79” and “3D” are the combined corner outfield and 1B/DH totals, respectively:

The mid-defensive spectrum positions, third base and center field, both had big years, exceeding the production of left field and coming close to matching combined corner outfield production. It was also a good year for DHs. Pitchers rebounded from their first ever negative RG performance to post a PADJ of 2, better than 2012 or 2014. In 2014 pitchers hit .122/.154/.152, so their .132/.160/.170 performance saw upticks in both BA (+.010) and ISO (+.008).
In examining team performance, let’s start with the least important, the performance of NL pitchers. I need to stress that the runs created method I’m using here does not take into account sacrifices, which usually is not a big deal but can be significant for pitchers. Note that all team figures from this point forward in the post are park-adjusted. The RAA figures for each position are baselined against the overall major league average RG for the position, except for left field and right field which are pooled.

As usual, the spread from best unit to worst is around twenty runs.
I don’t run a full chart of the leading positions since you will very easily be able to go down the list and identify the individual primarily responsible for the team’s performance and you won’t be shocked by any of them, but the teams with the highest RAA at each spot were:
C--OAK, 1B--ARI, 2B--HOU, 3B--TOR, SS--HOU, LF--STL, CF--LAA, RF--WAS, DH--TOR
More interesting are the worst performing positions; the player listed is the one who started the most games at that position for the team:

This list is AL-dominated, with center field the only position where a NL team was last. But the main point of interest here is the futility of the Seattle catchers. They only slightly outperformed San Francisco’s pitchers, and that’s not hyperbole. Giant pitchers hit .169/.189/.294 for 1.39 RG; Mariner catchers hit .165/.214/.269 for 1.44 RG. Mike Zunino was the bright spot, hitting .181/.238/.311 for 2.13 RG in 375 PA as a catcher. The rest of the catchers combined to hit .136/.168/.191 for .24 RG in 197 PA. That RG would have ranked just fifth-best among NL pitching staffs, and was most comparable to the Dodgers (.127/.167/.175 for .20 RG). And every one of them was worse than Zunino (Jesus Sucre 1.02 RG in 133 PA, Welington Castillo -.54 RG in 22, John Hicks -1.08 RG in 31, Steven Baron -2.55 RG in 11).
This chart also makes it apparent why Brett Lawrie was of interest to Chicago, as both of his potential positions were the worst in the majors offensively (I wrote that prior to Todd Frazier also being acquired which means that both gaping holes have been addressed).
I like to attempt to measure each team’s offensive profile by position relative to a typical profile. I’ve found it frustrating as a fan when my team’s offensive production has come disproportionately from “defensive” positions rather than offensive positions (“Why can’t we just find a corner outfielder who can hit?”) The best way I’ve yet been able to come up with to measure this is to look at the correlation between RG at each position and the long-term positional adjustment. A positive correlation indicates a “traditional” distribution of offense by position--more production from the positions on the right side of the defensive spectrum. (To calculate this, I use the long-term positional adjustments that pool 1B/DH as well as LF/RF, and because of the DH I split it out by league):

In a typical seasons there are more teams with negative correlations than this, and Milwaukee’s +.90 r is about as high as you’ll ever see. But that was not a good thing as only their corner outfield spots were above average for their positions. As an Indian fan, it is quite common to see them near the bottom of the list thanks to their now decade-long struggle to put quality bats at the corners (and their success with players such as Grady Sizemore, Jason Kipnis, Carlos Santana, Yan Gomes, and now Francisco Lindor contributing offensively from up-the-middle positions). As a fan it can be frustrating to see a low correlation team and think that if they could just find decent offense at those spots that the offense would be great, but on the whole it’s a curiosity and of course the team’s composite offensive ability is what matters.
The following charts, broken out by division, display RAA for each position, with teams sorted by the sum of positional RAA. Positions with negative RAA are in red, and positions that are +/-20 RAA are bolded:

Toronto had the AL’s best production from corner infielders and infielders as a unit thanks to Josh Donaldson. The bolding illustrates that it was their big three that made this a special offense. Boston had the AL’s worst corner infielders, but I was initially puzzled by Baltimore’s poor showing at DH and not-great 7 RAA at first base despite the presence of Chris Davis. Davis did his best hitting at first base (965 OPS in 454 PA) and actually had more PA as a right fielder than a DH (122 to 94). The other Oriole first basemen, though, combined to hit just .200/.244/.385 over 217 PA. Note that the Yankees got average production at shortstop after having the worst hitting shortstop(s) in the majors in 2014, some guy whose name I can’t recall.

Minnesota had the AL’s worst outfield production, while Chicago’s infield was the worst in baseball (as noted above their second and third basemen were the worst, the latter just edging out Cleveland). I don’t have the energy to write the obvious about Kansas City’s offense, which was average despite good October fortune. Sometimes baseball is dumb.
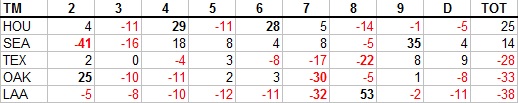
Houston had the best middle infield production in MLB. I never would have guessed that Seattle was above-average offensively; park illusions and narratives remain powerful things. Nelson Cruz allowed their outfield to lead the AL in RAA, and yet the three outfielders (+37) did not completely offset the horrid catchers (-41). The only team in the majors other than Los Angeles to have just one above-average position was the White Sox; that it was the second-best position in the majors must make Mike Trout really angry sometimes.

Washington had the majors’ most productive outfield thanks to Bryce Harper’s amazing season. Miami had the worst corner infielders in the NL. Remember that these figures are against the major league average, so the Mets aren’t being compared to a lower baseline than the Royals--their position players were better offensively relative to their positions.

The Cubs and Reds tied for the most productive corner infields in MLB, doing it in opposite ways, Chicago with near perfect balance and Cincinnati with a big season from Joey Votto and solid production from Todd Frazier. But the Reds gave it all back with the majors’ worst outfield, led by their center field disaster which they compounded by leading off their center fielders in 75 games (shortstop 66, left field 12, second base 7, right field 2).

As mentioned above, the Angels were below average at eight of nine spots; uptown the Dodgers were the only team without a below average position. Solidly above average everywhere with only one standout position led to the second highest composite RAA in the majors. Their archrivals were right behind with just two less RAA and one below average position, but three positions were standouts and they led the majors in infield RAA and the NL in middle infield RAA. Arizona had the worst middle infield RAA in the majors.
The full spreadsheet is available here.
Tuesday, January 12, 2016
Hitting by Position, 2015
Subscribe to:
Post Comments (Atom)
No comments:
Post a Comment
I reserve the right to reject any comment for any reason.