Unfortunately I do not have time right now to run my full end of season stats report (I will be doing it, but it will have to wait for November). However, since the park factors are the element that generates by the far the most interest (as in twenty people are interested rather than five), I wanted to get them posted in a reasonably timely fashion.
For an explanation of the calculations, see the overall explanatory post from last year . This year I did include five-year park factors for San Diego and Seattle due to the outfield dimension changes in this park. My usual approach, which is not optimal but is simple to implement (particularly when figuring historical park factors), is to treat any park with dimension changes as a new park. One could also weight the current year more heavily but still consider prior years or take some other approach, but all I’ve done in this case is provide the five-year park factors as well, listed on the table as SD-5 and SEA-5. In the case of Petco, the one-year factor is .95 and the five-year factor is .92. The difference in the Safeco factors is more extreme--1.00 for one year, .94 for five years.
2013 Park Factors
Saturday, October 05, 2013
2013 Park Factors
Tuesday, October 01, 2013
Crude Playoff Odds
In a world where there are plenty of sources for playoff odds that actually take into account the personnel currently available for each team, projected rather than 2013-only performance, pitching matchups, and the like, there is no real reason for me to post this. Nonetheless, here are some very crude playoff odds. The key assumptions:
- Team strength is constant and is measured by my Crude Team Ratings, using an equally weight of W%, EW%, and PW% regressed with 69 games of .500
- Home field advantage is uniform and the home team wins 54.5% of the time
From there, the math is pretty simple and I will present with little explanation. First, the ratings which are used to feed the estimates:
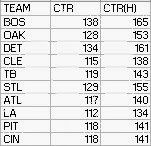
You may be surprised to see the Dodgers as the weakest playoff team in the ratings, but the NL West was not a strong division and the Dodgers' SOS in the ratings is just 28th, ahead of only Washington and Atlanta. LA ranks 11th in MLB in the ratings, with the ten teams ahead all being in the playoffs except for #8 Texas.
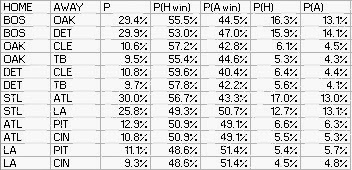
Odds for the wildcard games:

For the Division Series:

For the LCS:
For the World Series:

110-1 for a Cincinnati/Cleveland series.
Put it all together:

Subscribe to:
Posts (Atom)